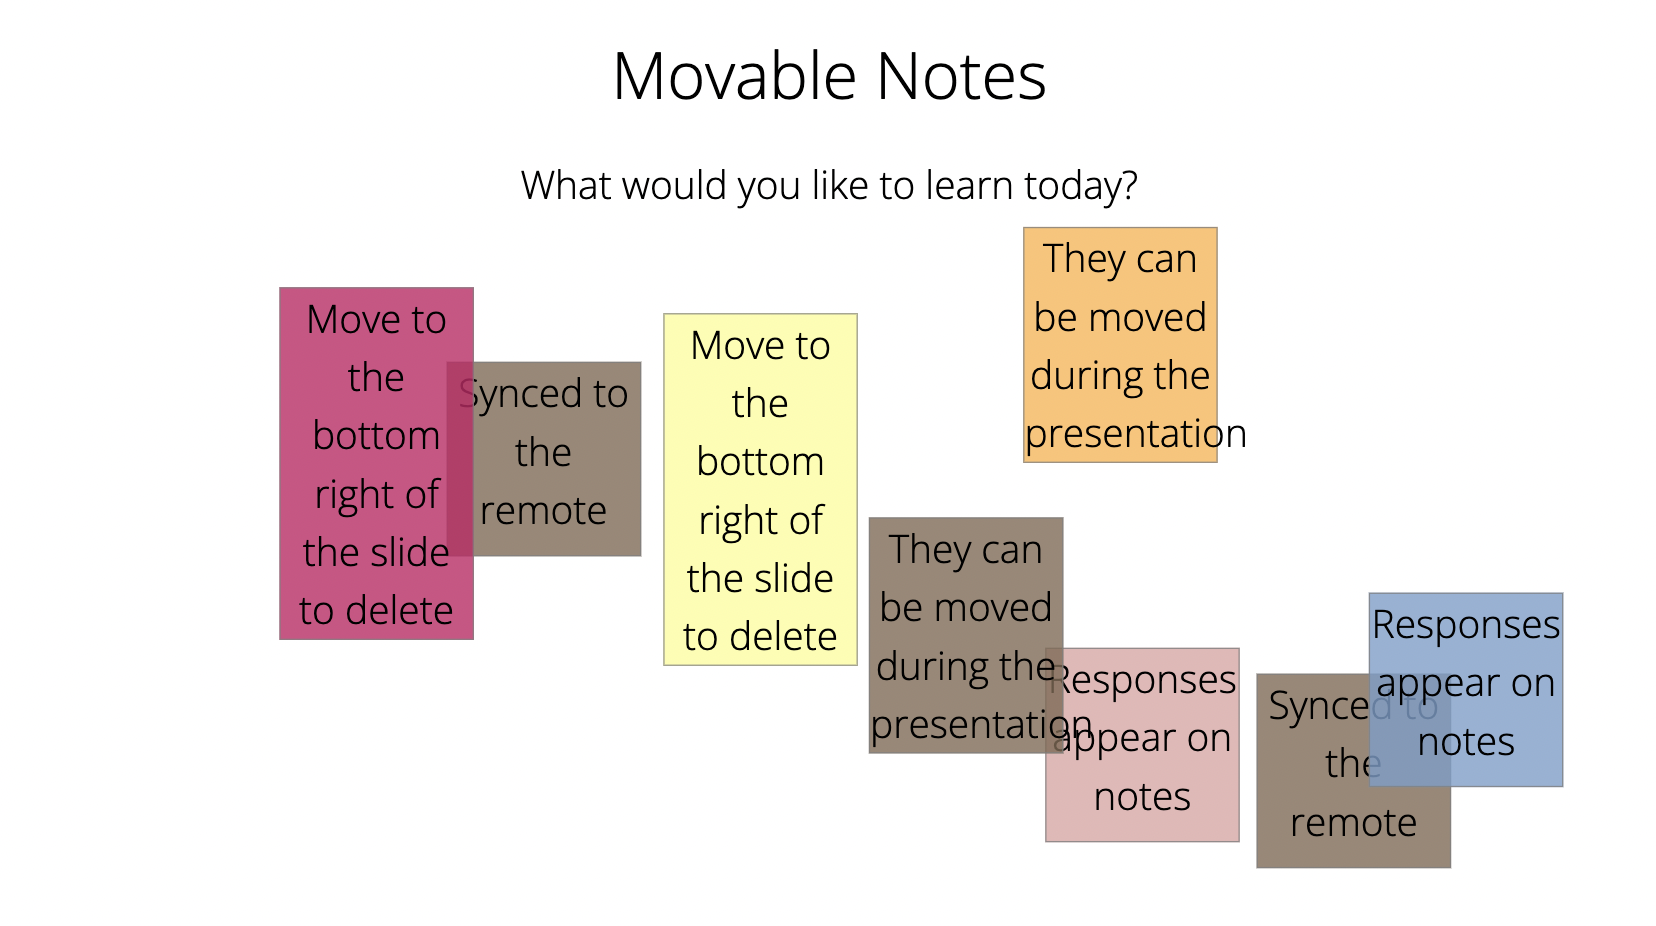
2Sli.de features 16 types of interaction and visualization

Movable Notes

Text responses to a prompt are displayed as multicolor notes that pop up at a random location. The remote can be used to move and group the notes. Moving the note to the bottom right corner deletes it. By default, responses are filtered for profanity, and an option to moderate/approve responses before they pop-up is on available.

Word Cloud

Text responses to a prompt are displayed as multicolor wordcloud, with more frequent words displayed in a larger font. This is useful for getting a sense of overall views or opinions without displaying the full content of any single response.

Poll with Graph

Responses to a multiple choice question are displayed on a bar graph that shows the percent who voted for each option. Up to seven options can be presented. Unlike a quiz, in a poll, there is not usually a correct answer.

Poll with Table

Responses to a multiple choice question are displayed on a table that shows the percentage of responses for each of up to seven options.

Quiz Question

Responses to a multiple choice question, with the response slide showing the correct answer and a bar graph of the perecent of responses for each option. Respondents are given a pseudonym (e.g. CrazyCamel22) to track their performance.

Quiz Leaderboard

A quiz leaderboard can be added to a presentation with one or more quiz questions. It shows the top participants ranked by the numer of correct responses. To keep the quiz interesting, add leaderboards throughout so participants can see how they are doing.

Upvote Test

Participants can choose to enter a text response to a text, or vote for an option that has already been entered, which will then raise it's position in the list of responses. This is a good way to crowdsource participants' preferred response to an open-ended question.

Numeric

Participants respond to a prompt with a number. Presenter can select various statistics to display (average, maximum, minimum, and standard deviation).

Slider Rating

Participants rate their position along a continuum with two endpoint labels, with a responses shown as colored dots. This shows the range of views among participants on a given question or prompt.

Live Rating

Participants rate their position along a continuum, with results updated in real time. This is useful for tracking changes in views or sentiments throughout a session.

Show Position

Participants show their position along a continuum with two labeled endpoints, using a custom colored marker. Useful for gauging a range of views on a particular question or topic, while allowing participants to identify their position and possibly discuss it later.

Show Position (2D)

Take two previous "Show Position" interactions and display responses as a two-dimensional visualization, with respondents' poisition indicated by a marker of their choice.

Cross-Tabulation

Display responses to two previous multiple choice interactions (e.g. a poll or quiz question) as a table, with cells indicating the count of each combination of responses.

Scatterplot

A two-dimensional graph showing responses to two previous "Slider Rating" responses, with responses indicated as multi-colored dots

Group Allocation

Respondents are allocated to a group (based on a specified number of groups). This can be used to create discussion groups, teams, etc.

Response Counter

Show the number of responses received for any interaction, updates in real-time.